Multiple Analytics Extensions Connections with Tableau Server 2020.2

Tableau Server 2020.2 is released (https://www.tableau.com/support/releases/server/2020.2) and among many new features and improvements, there is one which is specifically related to what this blog is about.

With this improvement, it is possible now to have multiple connections for one server (one connection per site) – TabPy, Rserve, Ople.ai, AtlTabPy, MatLab version of TabPy, etc. This allows organizations to have different analytics extensions per department or user role.

Multiple Analytics Extensions (former External Services) connections feature is explained as:

Server administrators can now configure multiple Analytics Extension (formerly External Service) connections in Tableau Server. Administrators can set one per site through the Settings UI and turn connections on or off at the Site level. Now teams using different R, Python, and other external data science environments can share their work with consumers across the same Server. Settings are easier than ever to configure with UI controls or via the Server REST API.

https://www.tableau.com/products/new-features#feature-128745

We will look at REST API some other time and in this post I just want to show you how to configure a connection for a site. Tableau documentation for the configuration is at https://help.tableau.com/current/server/en-us/config_r_tabpy.htm.

It is important to understand that web UI or REST API are now the only way to enable, disable and configure analytics extensions – TSM doesn’t provide that functionality anymore.

To enable analytics extensions feature which is disabled by default you need to be a server administrator. The screenshot below shows how to enable the feature for the whole server:

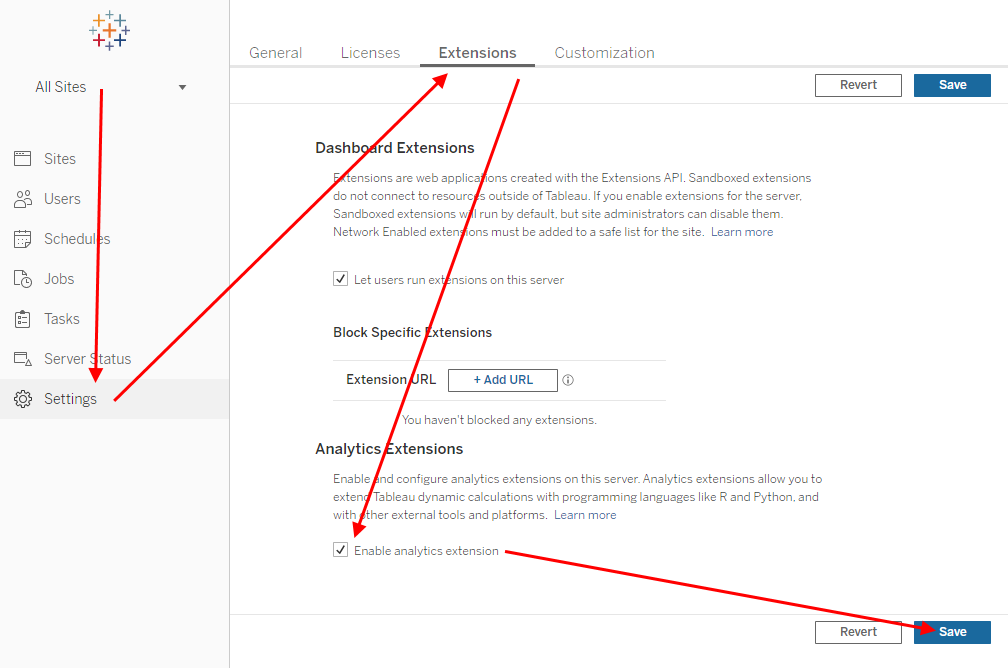
Make sure you are configuring All Sites, go to Setting, Extensions tab, set Enable analytics extension checkbox and click Save.

With the feature enabled for a server now you can configure a connection for each specific site. To be able to do so you need to be a site administrator. The next screenshot demonstrates how a connection can be configured:

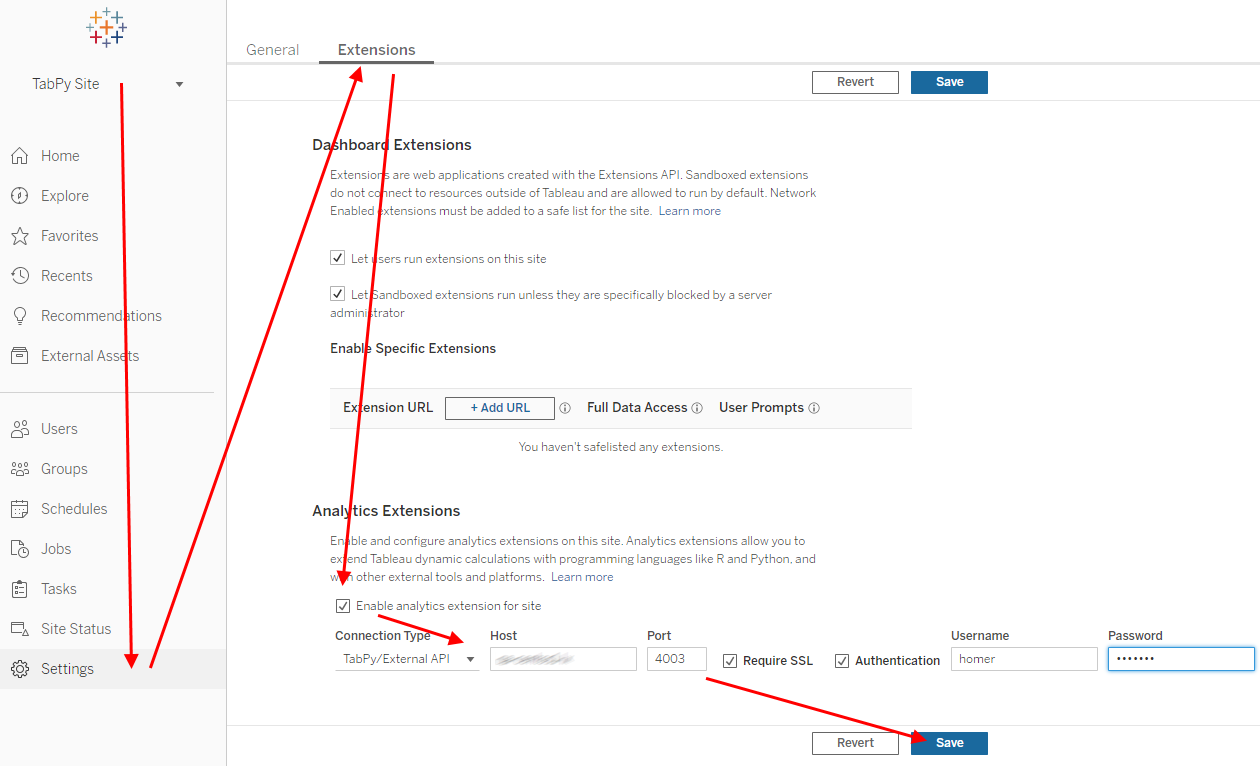
Select the site you want to configure (on the screenshot it is TabPy Site), go to Settings, Extensions tab, set Enable analytics extension for site checkbox and configure a connection with setting Connection Type, Host, and Port. Set Require SSL and authentication parameters as needed (read How to configure TabPy with authentication and use it in Tableau for authentication configurations steps) and click Save button.

With the configuration successfully saved all the workbooks published on the site will use the configured connection. For workbooks on other sites connection from that site (if configured at all) will be used.

Share the post if you liked it

How to run TabPy with Anaconda on Linux

What Anaconda is can be explained in many ways depending on how and what you use is for. In the case of TabPy Anaconda serves as Python environments manager which allows having different Python environments (different versions of Python with a different set of packages) on the same machine. To learn more about Anaconda and where it can be used to start at https://www.anaconda.com/.

First question to ask is why you may need to use Python environments. There are many reasons. Couple of the most important are:

  • Your OS may have old version of “system wide” Python (e.g. Python 2.7) and it is not easy (or not possible at all) to update it without breaking something, and
  • You may want to isolate TabPy environment with packages it needs from your other environment (development, training models, etc.), or
  • You may want to have multiple independent TabPy instances each with their own set of packages awailable.

To manage Python environments Anaconda is not the only option, you can use Python virtualenv tools for example – https://virtualenv.pypa.io/en/latest/. However Anaconda has some advantages like nice UI app to manages environments and packages, saving/restoring/sharing enviroments, support for R environments, etc.

And when for Windows and Mac you can use UI app in many cases for Linux GUI is not an option. In other words you will need to use command line. And this is what rest of this post shows how to do.

After login to a Linux machine, you need to download Anaconda installer from https://www.anaconda.com/distribution/. The following commands assume you are in your home folder (run cd ~ to navigate to your home folder). On the Anaconda distribution page find the link for the latest version for Linux and run the following command:

wget https://repo.anaconda.com/archive/Anaconda3-2020.02-Linux-x86_64.sh

Now when you have the installer in your home folder run it:

bash Anaconda3-2020.02-Linux-x86_64.sh

When the installer finishes add path to the Anaconda to the environment variable (this assumes bash is your Linux shell):

echo 'export PATH="~/anaconda3/bin:$PATH"' >> ~/.bashrc

In the command above we add anaconda3 subfolder bin from the user home folder to environment variable PATH so anaconda commands can be found regardless of what is the current folder. If you installed Anaconda in a different location the command need to be modified properly.

Now let’s restart shell (or you can unlog and log in again):

source ~/.bashrc

Next let’s update Anaconda:

conda update conda

In the command above conda is the tool which will let us perform different Anaconda operations.

Next step is to create new environment for TabPy:

conda create --name TabPy python=3.7

What happens in the command above is new environment with name TabPy is created and it has Python 3.7 available for it.

You can have as many environments as you need with different or the same Python versions. As all of them are isolated and do not interfere it is possible to have different sets of packages or the same packages of different versions in them.

Now we can activate the environment:

conda activate TabPy

If the command succeeds you’ll the command prompt is updated to have the environment name in it.

And now you can install TabPy and other packages:

python -m pip install --upgrade
pip install tabpy
tabpy

To exit from the environment run deactivate command:

conda deactivate

For how to configure TabPy read https://tabscifi.golovatyi.info/2020/01/tabpy-modifying-default-configuration/.

Share the post if you liked it

Add colors to TabPy console output

Let’s brighten the day, shall we?

In one of my previous posts, I explained how logging can be configured for TabPy: levels, the format of the message, where it is sent/stored, etc. Read here for more detail – How to Configure Logging in TabPy?

I also mentioned there is number of handlers from provided with Python (console, file, and others). But it is also possible to use third party or customized handlers. With this post, I am going to show how you can make console logging colorful with third-party formatter.

First, we need a formatter. You can choose any, I for the demonstration purposes picked up colorlog (https://pypi.org/project/colorlog/). The most important thing you need to pay attention to is how the formatter messages are formatted… Yes, you’ll need to define the format for the formatter. For the one I chose documentation for the format arguments is on the PyPi and GitHub (https://github.com/borntyping/python-colorlog) pages for the package.

Let’s install the package:

pip install colorlog

Next, we need a configuration file (additional reading – TabPy: modifying default configuration):

[loggers]
keys=root

[logger_root]
level=INFO
handlers=console

[handlers]
keys=console

[formatters]
keys=console

[handler_console]
class=StreamHandler
level=INFO
formatter=console
args=(sys.stderr,)

[formatter_console]
class=colorlog.ColoredFormatter
format=%(asctime)s [%(bold)s%(log_color)s%(levelname)-8s%(reset)s] %(log_color)s%(message)s%(reset)s
datefmt=%y/%m/%d %H:%M:%S

In the file everything till line 20 is standard: define loggers, handlers, and formatters. And now with the only formatter defined we want to use formatter from the package previously installed. The line class=colorlog.ColoredFormatter tells Python logger to use specified formatter (ColoredFormatter) from colorlog package.

For the format parameter which defines what will be in a logged message we use formatter specific arguments: %(bold) makes text bold, %(log_color) sets the color for following text, and %(reset) changes text attributes to default. Again – for any other formatter you choose to use the arguments list most likely will be different.

Running TabPy with the config and querying it will look something like this:

Share the post if you liked it

Extending Tableau with Ople.ai and new functions

In my previous post Haskell in Tableau? Yes, you can! I mentioned an example of Analytics Extention API implementation in the way it allowed to use Haskell in Tableau calculations.

And there are more examples of how Tableau calculations can be extended:

Do you know of any other examples worth sharing?

Share the post if you liked it

Tableau Server 2020.1: Analytics Extensions Improvement

Similarly to Tableau Desktop 2020.1 improvements for analytics extension (formerly referred to as external service) Tableau Server 2020.1 also presents some improvements.

Specifically for configuring an analytics extension connection for Tableau Server there is no need to provide a certificate for tsm security vizql-extsvc-ssl enable command and --cert-file parameter is not supported anymore.

The certificate validation works in exactly the same way as it does for Tableau Desktop which means root certificate, self-signed certificate or the whole certificate chain (for Rserve) has to be installed as trusted on Tableau Server nodes.

With this improvement, there is no need to share an analytics extension certificate and it can be validated against what is configured on client machines (nodes running Tableau Server).

More details about configuring a connection for Tableau Server can be found at https://help.tableau.com/current/server-linux/en-us/cli_security_tsm.htm#tsm_security_vizql-extsvc-ssl-enable.

Share the post if you liked it